
Scanning for undervalued dividend stocks
January 25, 2019
How metrics make you pay
January 30, 2019In How Metrics Make You Pay we have seen that the most common metrics like p/e ratio, dividend yield and even terms like “dividend aristocrats” are not capable to detect long-term profit growth – which is essential for a successful investment. Even worse: these approaches may be misleading, making stocks with low and unreliable long-term-profit look like attractive buys.
Back to the roots: Why historical profit growth matters
Since the stock market trades the future, you may ask if analysing profit-growth of the past makes any sense? It surely does. In a casino, playing red on a roulette wheel ten times in a row won’t help you to predict what’s coming next. But a company which increases its profits ten times in a row has a significantly higher chance of doing so in the following year. This assumption stands in stark contrast to a company which merely has a mixed earnings history. In a competitive environment, generating profits requires effort – this doesn’t occur coincidentally. Turning profits ten years in a row and more can be regarded as the financial manifest of an excellent business model, along with sound business processes, capable management, as well as with strong brands combined with market power. Even if this may not be true in any case, you can generally assume that a diversified portfolio has a strong potential of doing so.
Hence, the quest for a primary metric to detect long-term-profit growth makes sense.
Hang on! The break through is not far away…
Profit growth rate
All attempts to detect profit growth while using dividend related metrics failed. Hence, it seems obvious to quantify profit growth using increase rates. Yet, long-term profit growth needs to be reliable and this cannot be ensured by connecting two points and calculating the average increase rate. That is why what happened in-between these two points in time is the important factor. Have the earnings increased smoothly by a similar rate or was it more like riding a roller coaster? In case of the latter, increase rates are misleading, as the example of Chevron (CVX) shows:
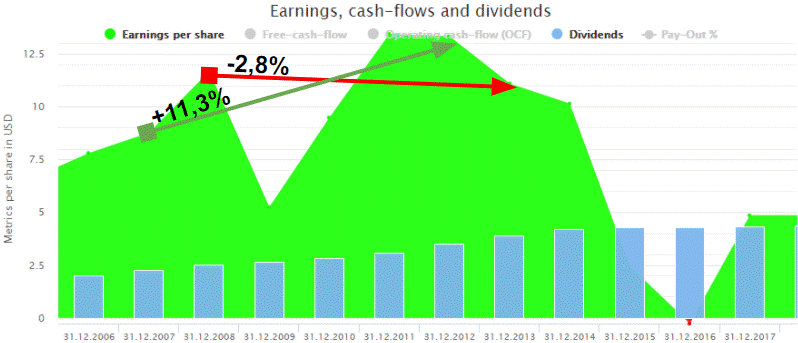
From 2007 to 2012, the five years increase rate (CAGR) amounts to solid +11,3 %. Yet, moving one year forward, the 5 years CAGR drops to -2.8 %. Applying the CAGR to companies with unreliable profits goes along the lines of gambling. Therefore, the CAGR alone doesn’t serve as a key metric.
How to determine stable profit growth
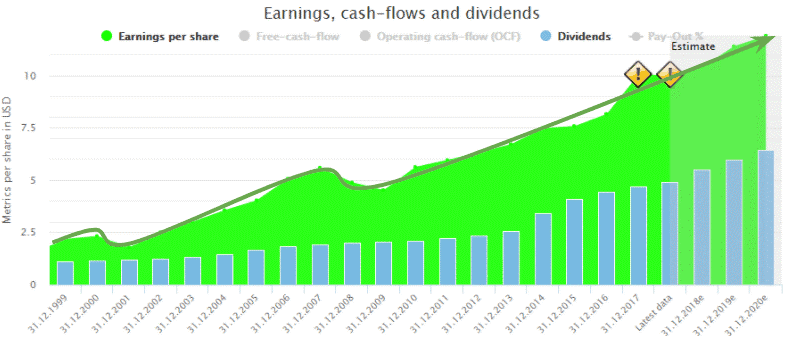
The key to reliable profit growth is stability. Stable profit growth can be quantified by using correlations. These correlations range from -1 to +1. A ‘1’ thus stands for a perfect match between time and profit. The profit basically looks like a line drawn by using a ruler (as shown below). If the profit increases, then the correlation is positive, otherwise it is negative. A zero indicates no trend in profit growth at all – imagine a wave constantly going up and down.
Furthermore, stable profit growth signifies high correlation. The chart below presents the earnings history of 3M (MMM) with a correlation over two decades as high as +0.97.
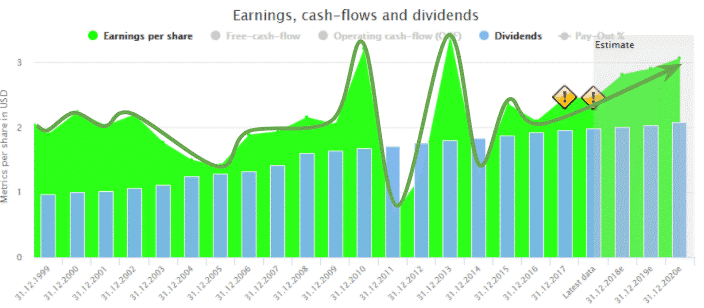
Compare this to another dividend aristocrat, AT&T (T), whose earnings correlation is only +0.18:
High correlation represents reliable profit growth. My personal limit to finding proper high-quality stocks is +0.8, which is a limit exceeded by many successful companies. Hence, it is easy to build up a pleasantly diversified high-quality portfolio for any investor.
Earnings and cash-flow correlations are predestined to be used as key metrics, because correlations translate long-term profit growth into a single, easily understandable number.
Combining correlations and growth rates
The correlation describes the profit stability, but not the rate of profit growth: Stability of profit growth and profit growth rate are two different things. Luckily, these metrics can be combined to demonstrate a true picture of profit growth.
Yet, the combination of correlation and increase rates solely makes sense for companies with a stable profit growth, because otherwise the profit increase rate is too unreliable. Fortunately, companies with a stable profit growth are exactly the companies you should invest in.
The table below once again shows the dividend aristocrats with disappointing capital gains within the last 10 years. Yet, this time, stability and increase rates of profit growth are also shown.
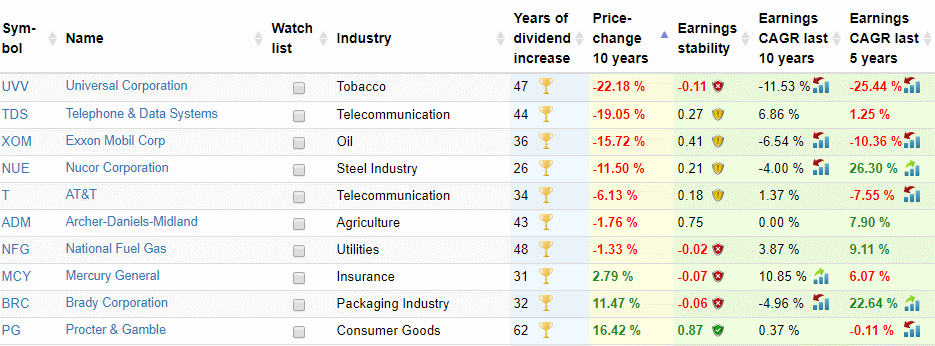
It’s striking that only Procter & Gamble has a high correlation of profit growth, but its profit increase rates over 5 and 10 years are close to zero. Most of the other dividend aristocrats have a low or even a negative profit correlation combined with very low increase growth rates. If the increase rates are high, they miss any validity because of lacking profit stability. That’s the case for Nucor Corporation (NUE) and Brady Corporation (BRC), both companies with low profit stability.
The combination of correlation and increase rates is called “Correlation-Growth-Model” or CGM in short. The term CGM is used in the following chapters, describing the advantages of this model for any long-term investor.
Advantages of the Correlation-Growth-Model (CGM)
Consideration of the essence
Instead of losing yourself in secondary metrics just as margins, debt, book values, dividends and so on, the CGM focuses on the essence: the long-term profit growth. Everything else is secondary and may be used afterwards to further limit the number of stocks according to your own strategy. But starting with secondary metrics is a waste of time if long-term profit growth is missing.
Applicable on your own strategy
The CGM can be expanded by any secondary metrics you desire. Apart from this, the two metrics of the CGM alone are already flexible enough to be adjusted to your strategy. The increase rate determines the balance of yield and risk because companies with high increase rates tend to have a higher valuation than companies with lower growth rates.
A risk-averse investor probably prefers a combination of very high profit stability and low to medium profit increase, whereas a more risk-inclined investor also needs to keep an eye on high profit stability but rather invests in companies with high increase rates.
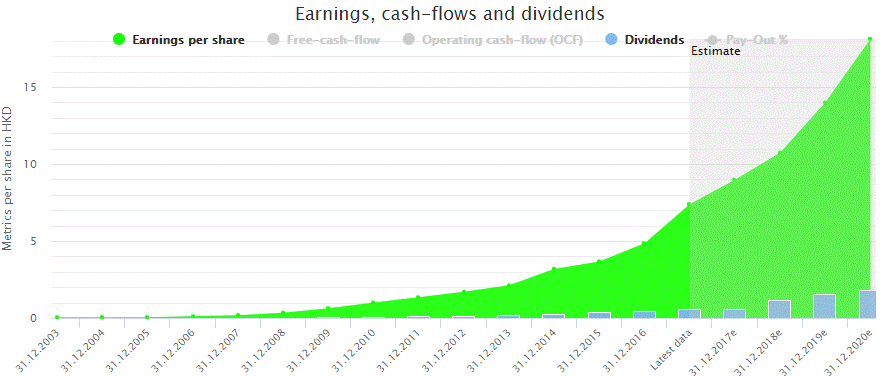
Tencent (TCEHY) is an example of the high-quality stock with an annual profit increase of about 30 % within the last 5 years and an earnings correlation of 0.87:
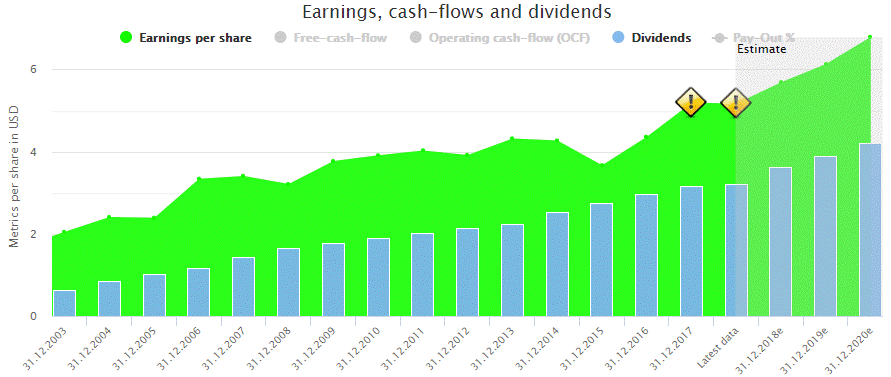
In contrast, Pepsi is a rather conservative high-quality stock with an annual profit increase of just 4 % within the last 5 years and an earnings correlation of 0.96.
Easy to understand
Other stock valuation models consist of many more metrics, whose interpretations are based on assumptions which are often difficult to understand without further background knowledge. For example, Morningstar Moat focuses on Network Effect, Intangible Assets, Cost Advantage, Switching Costs and Efficient Scale to find promising companies to invest in; the Piotroski F-Score even uses 9 different secondary metrics to find promising stocks. To understand these, you need to dive rather deep into the topics. And if I’ll ask you the following day about these 9 metrics, I am quite certain that you forgot about some of them – at least I would.
The CMG, however, consists of two metrics only and the logic of the CMG should be easy to understand for non-professionals, too.
Psychological support
The CGM is easy to understand because its underlying logic can be drawn on a single chart as we have previously seen. Look at the earnings growth of Pepsi or Tencent above once again. You immediately see that these are high quality stocks. In contrast, it’s much more difficult to get the big picture when looking at a table containing diverse metrics.
It’s much easier to believe in something you can see. Especially when the stock market tumbles, this belief can be regarded as a great psychological advantage since the risk of precipitous sales due to panic is reduced.
Applicable to all investing strategies
In general, each analysis method has its own investing strategy. The Piotroski F-Score, for example, was developed in order to find promising turnaround candidates of low or medium market capitalization. Others merely apply dividend-related metrics which only focus on dividend stocks.
The CGM has its focus, too – profit growth. But this is no artificial limitation just like the focus on dividend stocks. The focus on profit growth is the least common denominator of all promising investment strategies. An investor buying stocks regardless of a long-term profit growth is most often gambling.
Applicable to profit related metrics and more
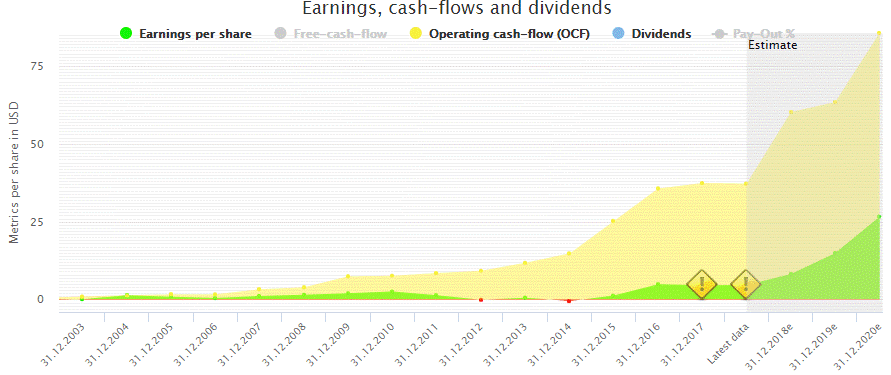
The CGM is profit growth-oriented. Yet, this does not mean that the CGM can be used for earnings only. Cash flow and revenue growth are examples which prove that the combination of correlation and increase rates is useful, too. Sometimes moving away from earnings is even a must! Amazon (AMZN) is evaluated more effectively by using operating cash flows because earnings aren’t Amazons priority, yet:
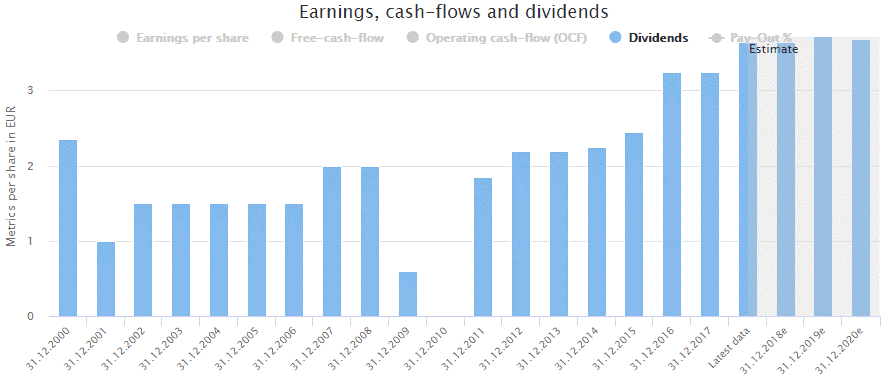
The CGM can be used to describe dividend growth as well. As an example, the dividend yield of Daimler (DDAIF) is as high as 4,8 %, but its dividend stability (correlation) of +0.49 describes a rather unreliable dividend history:
In fact, the CGM describes dividend growth even better than common dividend metrics just as, for example, the number of years of dividend increase. SAP (SAP) has only increased its dividends for 7 years in a row, but its dividend stability is higher than that of many dividend aristocrats because the dynamic of dividend increase can differ considerably over time. This will, in turn, lower the dividend stability.
The Correlation-Growth-Model in the wild
DividendStocks.cash offers diverse combinations of the CGM, in which increase rates are calculated for 10 and 5 years.

The available combinations of the CGM are applied to:
- Earnings per share
- Operating Cash flow per share
- Revenues on company level
- Dividend per share (as secondary metric, because dividends are not related to profit growth)
These CGM related metrics are shown for every stock. The table below presents the already known dividend aristocrats with disappointing capital gains once more. This time, though, CGM related metrics for operating cash flows, revenues and dividends are shown as well. In general, earnings, cash flows and revenues are strongly correlated to each other.

An overview of all available metrics on DividendStocks.Cash is available here.
Drawbacks
In the wild, the CGM’s construct has two drawbacks.
1) Personal responsibility
The CGM makes finding stocks with reliable long-term profit growth easier than ever before. Yet, an investment strategy is more than ‘just’ investing in high-quality stocks. Most other approaches, especially scoring models, can thus be applied mechanically. That is why this model demands taking an effort about your own investment strategy. It could also be that the CGM alone is not sufficient and you need to add some secondary metrics to it. To give some examples, this could, one the one hand, be the dividend yield if you are a dividend income investor or, on the other hand, fair values if you are value-oriented.
Although investors using the CGM invest in companies with reliable long-term profit growth, their final investment strategy still differs, as do risk and yield.
2) Availability of metrics
This is possibly the biggest obstacle. While growth rates (CAGRs) are still available, correlations of earnings, cash flows and revenues are not. Nevertheless, that’s only because the CGM is still new and not yet widely adopted.
Conclusion
The CGM is a new approach and its success in the investment industry therefore still unknown. If it succeeds, you are free to claim that you embraced it from the very beginning. If it fails, you still know about the importance of long-term profit growth and the dangers of most commonly used metrics.
This article was first published on Seeking Alpha with the title “How metrics make investors pay part II“.

