The key to successful investing
January 30, 2019
Winner and loser stocks January 2019
February 1, 2019Despite careful stock selection, many investors are dissatisfied with their long-term performance. There are several reasons for this. Much is written about the lack of basic knowledge, wrong expectations and a bad or no strategy at all. Mostly forgotten remains the fact that metrics contribute to investor’s frustration, too. Metrics such as P/E-ratio (price-earnings-ratio), dividend yield, pay-out ratio and dogmas like the believe in dividend aristocrats are omnipresent. Hardly any financial site on the Internet and any introduction into the stock market can do without them. Therefore, pretending that these metrics and dogmas do more harm than good may be surprising.
It’s all about long-term profit growth
Some investors prefer high dividends, others prefer dividend growth, and some look at valuation and don’t care about dividends at all. As different as investors are, they have one thing in common: the long-term performance of any of their stocks depends on the long-term profit growth of the respective company.
Profit growth means capital gains at first and growing dividends at second place. Mr. Market’s moods sometimes hide this relationship for a certain time. But over the long run, profit growth always leads to capital gains. In a similar vein, companies with stagnating or even declining profits are a bad investment because of a suffering stock price.
Dividends are overrated
There are misconceptions about the importance of capital gains vs. dividends. First misconception: capital gains are unpredictable, but dividends are. Second misconception: dividend’s share regarding the total yield of return is overrated.
Comparing the performance of the S&P 500 with and without dividends proofs both misconceptions to be wrong.
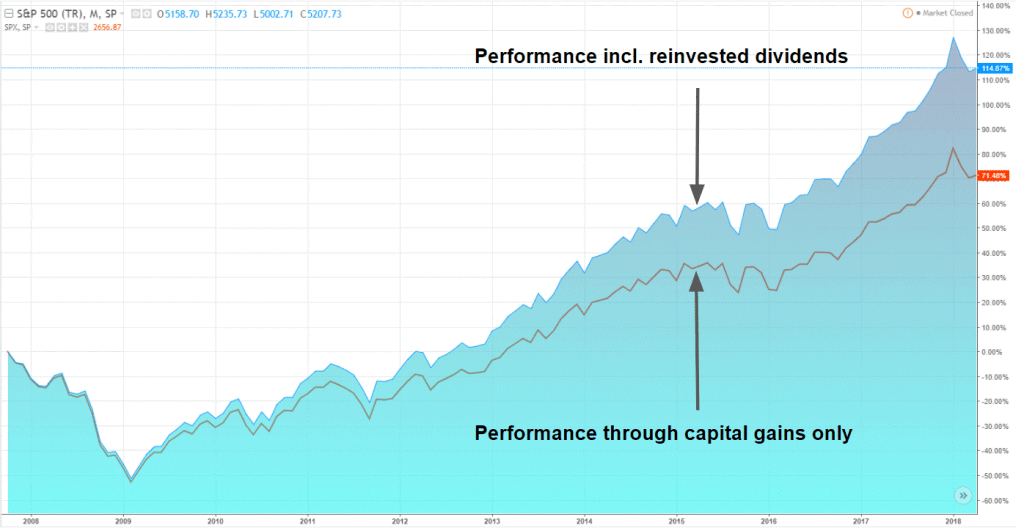
71.5 % out of 115 % total return since 2008 was related to capital gains. An additional 43.5 % was due to dividends. Yet, included in these 43.5 % are capital gains, too – because reinvested stocks also participated in capital gains in the following years.
Although dividends are an important attraction of the stock market, your overall long-term performance primarily depends on capital gains. And these directly depend on the profit growth of the company. This means, it ultimately doesn’t matter how your investment strategy looks like, e.g. if you prefer dividend stocks or not. You always need to find companies with growing profits. Otherwise you will perform badly (stagnating profits) or even lose money (declining profits).
Key metrics
Key metrics are responsible for the most important task of any investor: identifying companies with growing profits. Secondary metrics are applicable in a second step. Their purpose is to further limit the list of promising candidates according to your strategy. A dividend growth investor may discard any stocks with low dividend growth or no dividends at all. A value investor will be interested in stocks with low valuation and so on.
This article is about key metrics, which are primarily responsible for your success as an investor, whereas secondary metrics are primarily responsible to make you feel good. A metric can be used both as key or as secondary metric. To be useful as a key metric, it must be capable to identify long-term profit growth. If it isn’t, the metric is misleading and its use as a key metric must be avoided at all costs. Part I. of this article examines the usefulness of the most popular metrics as key metrics.
The price-earnings ratio as key metric: a danger for any investor
The price-earnings ratio (p/e ratio) is maybe the most commonly used metric to evaluate stocks. The lower the p/e ratio, the cheaper the stock looks like. Using the p/e ratio as key metric presents two common pitfalls.
Catching a falling knife
The following chart shows the relationship between profit growth and p/e ratio. The flattening earnings in 2015 indicate problems. The stock price drops and so does the p/e ratio. The stock seems to become less and less expensive in the following years. As earnings decline, the stock price declines even faster. According to a cheap p/e ratio, the stock gained attraction.
Yet, the considerable price drop was the reaction of the market due to the company’s lacking profit growth. Finally, the stock price continued dropping from over 70 USD to about 20 USD. Even if you bought the stock in 2017 with an p/e ratio as “cheap” as 10, you would have lost about 50 % of your money in the following months.
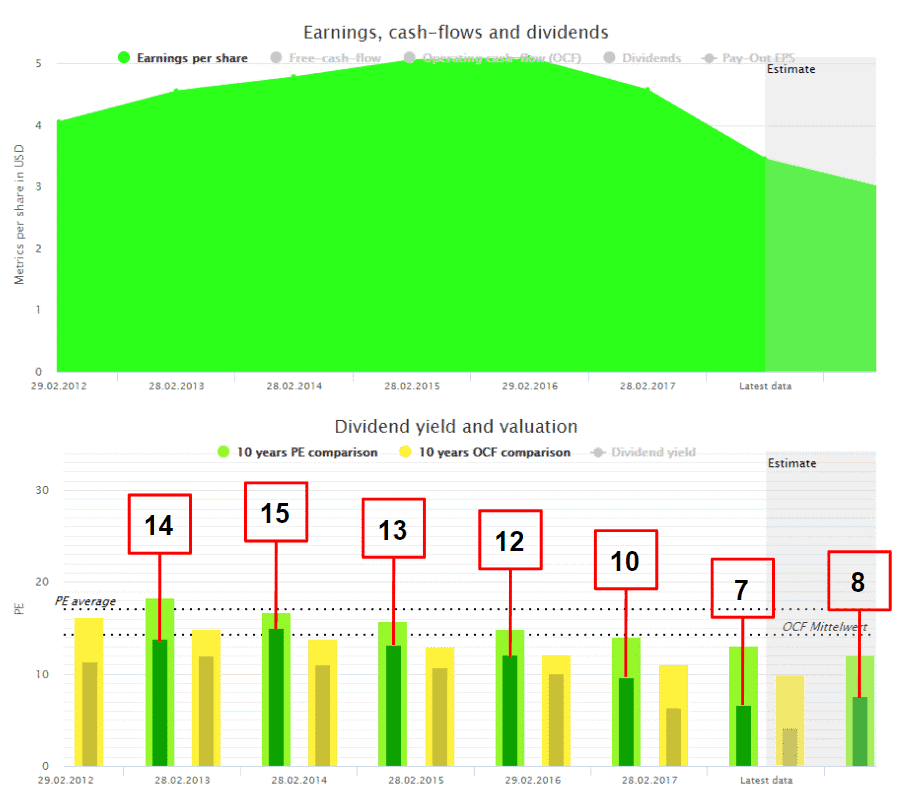
The stock market offers no free lunch. A stock trading with an ever-lower p/e ratio due to price drops is most likely in serious earnings trouble. Such a stock is rarely a good investment.
Selection of notorious low-performers
Some cheap looking companies did not experience a price drop because they always used to be “cheap”. The market simply never expected solid profit growth. These companies aren’t necessarily badly managed. Often, the industry they are operating in has limited potential for profit growth. Traditional car manufacturers are a classical example of companies with low p/e ratio.
Finally, it doesn’t matter if the low p/e ratio is related to the company or the industry, because a low valuation simply means the market does not believe in sustainable profit growth. Some investors buy cheap looking stocks anyway because they seem attractive at first sight. In general, the long-term yield is disappointing.
The same holds true for the book-to-price ratio and other metrics processing the earnings in the denominator. When trying to find stocks with solid profit growth, avoid these metrics at all costs.
The dividend yield: the treacherous complice of the p/e ratio
Dividends attract investors. In general, a high dividend yield means the same as a low p/e ratio. The market does not believe in solid profit growth, and the high dividend is the price the company must pay to make investors buy the stock anyway.
Solid profit growth and high dividends are contradictory. Investors must choose one or the other. The right decision favours profit growth.
The following chart shows the yield of return based on capital gains and dividends of AT&T within 17 years. AT&T’s dividend yield is about 5,6 %, but the stock did not perform well. For AT&T dividends are essential to achieve a positive outcome at all. Stocks like these remember an iceberg swimming in a red sea of capital losses. Adding some of these stocks to your portfolio considerably slows down your overall performance.

Avoiding high dividend yield in favour of profit growth is a double win. First, your chance of capital gains is much higher. Second, dividend growth of profit growing companies is much more dynamic.
The next chart skips capital losses to show only the cumulated dividend of AT&T. The nearly linear growth lacks any dynamic.

However, the dividend growth of 3M (MMM) resembles an upward curve:

Although dynamic, the dividend yield of 3M remains below the dividend yield of AT&T. This is due to capital gains of 3M, keeping the current dividend yield mostly flat. The next chart of 3M adds capital gains to dividends:

The share of dividends regarding the total yield seems negligible. Though, the cumulated dividend accumulates to 85 % of the initial capital compared to “only” 60 % in the case of AT&T. And the difference in capital gains is striking.
Like the p/e ratio the dividend yield tempts investors to catch a falling knife. In general, dividends are paid between once and four times a year. Contrary to a stock price changing within fractions of a second. As soon as problems arise, the stock price of the company concerned reacts. The dividend, however, remains stable at first and the current dividend yield even climbs. Like the p/e ratio, the dividend makes the stock look like an attractive buy.
The dividend yield of General Electric (GE) increased two times due to dropping stock price. Investors buying the stock suffered capital losses and dividend cuts.
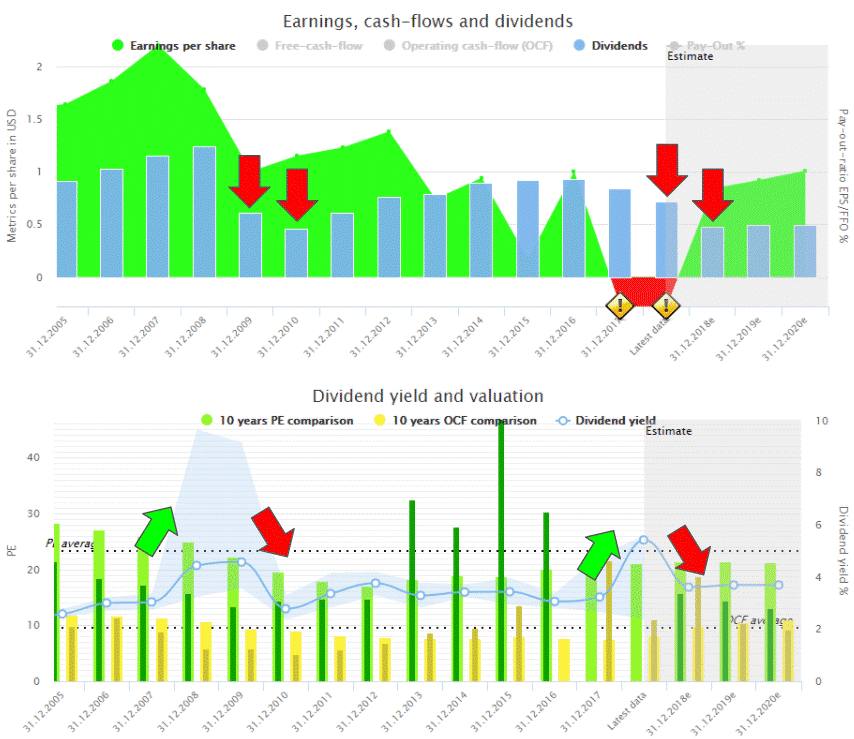
A suddenly increasing dividend yield is a warning sign. If a sound company is raising its dividends, the stock price follows, and the dividend yield remains mostly flat.
The pay-out ratio as key metric: snapshot without meaning
The pay-out ratio serves as safety belt for dividends. Low pay-out ratios mean the company’s potential to pay dividends won’t suffer immediately when earning problems arise.
That’s true, but it doesn’t help you to find companies with growing profits. Like the p/e ratio and the dividend yield the pay-out ratio is a snapshot of a specific point in time – contrary to profit growth covering a whole period. Depending on the point in time the pay-out ratio may differ substantially, as it does for National Fuel Gas (NFG) with a pay-out ratio constantly fluctuating between 30 and more than 100 %.

Because the pay-out ratio isn’t capable to detect profit growth, it cannot be used as key metric.
Years of dividend increase: Decoupling of dividends and earnings to the max
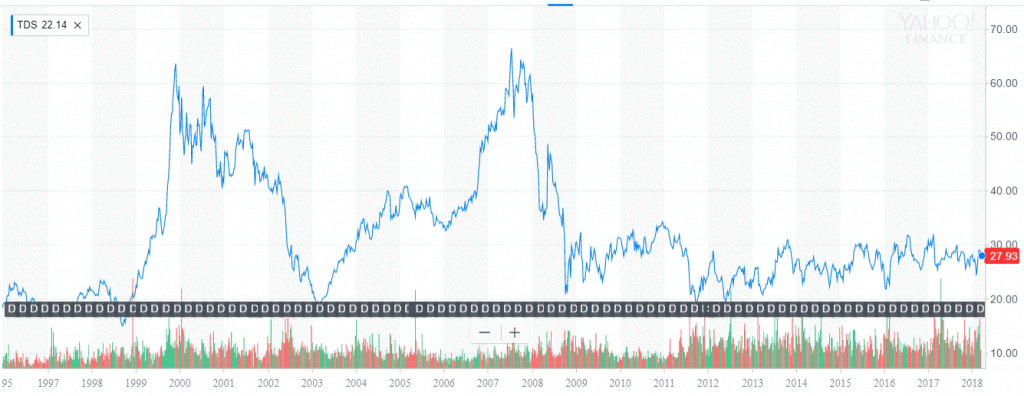
A company increasing its dividends for years must be good investment. As reasonable as this sounds, it’s wrong. Growing profits and increasing dividends are only loosely coupled. As an example, Telephone Data Systems (TDS) increases its dividends for 44 years without any sustainable profit growth.

No earnings increase for Telephone Data Systems
According to lacking profit growth, the stock’s long-term chart looks modest at best:
A company increasing its dividends despite missing profit growth is due to the cult of dividend aristocrats originating in the US and obscuring investor’s mind.
The list below shows the absolute capital gains within a 10-year period. Within the same period the S&P 500 increased by about 100 %.
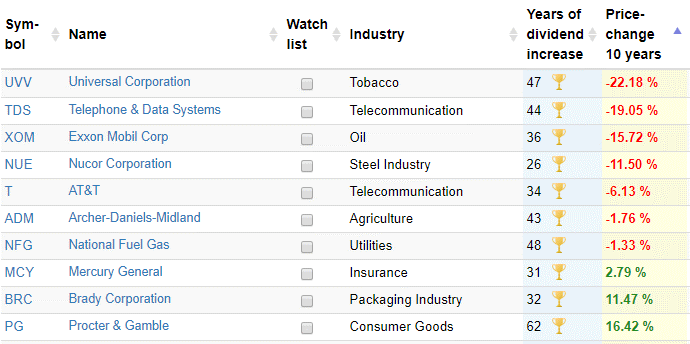
Dividend aristocrats and aspirants alike increase dividends to the maximum extent possible leading to a maximum decoupling of profit and dividend growth. Hence, the years of dividend increase cannot be used as key metric to identify profit growth.
Dividend growth as key metric?
If years of dividend increase are not related to profit growth, dividend growth it-self may be? The assumption of high dividend growth existing only in case of sound profit growth seems plausible. Unfortunately, it’s wrong. A change in dividend policy may lead to accelerated dividend growth independent of the company’s current profit growth.
A typical example are companies transitioning from a period of high to lower growth, as it was the case for Microsoft (MSFT) after the dotcom bubble exploded.

In this case high dividend growth is the result of lower profit growth. The exact opposite of what we expect. Because a company like Microsoft starts with a pay-out ratio of zero, dividends can be increased independent of current profits. Thus, dividend growth cannot be used as key metric as well.
Conclusion
The most popular metrics used by many investors are incapable of executing the most important task of any investor: finding companies with solid profit growth. The current workaround is to rely on sets of secondary metrics to find promising investments anyway. This typically leads to a mess of unrelated secondary metrics thrown together using a scoring model.
It’s naïve to believe that an overall score composed of several secondary metrics can detect solid profit growth if any of these metrics for them-selves cannot. Though, this is exactly what happens.
Wouldn’t it be much easier to have a single key metric identifying solid profit growth in a first step, and then in a second step using secondary metrics to select among the high-quality companies those matching your personal investment strategy the most? Sound like a dream? It’s not as you’ll see in The Origin of Successful Investing.
This article was first published on Seeking Alpha with the title “How metrics make investors pay“.

